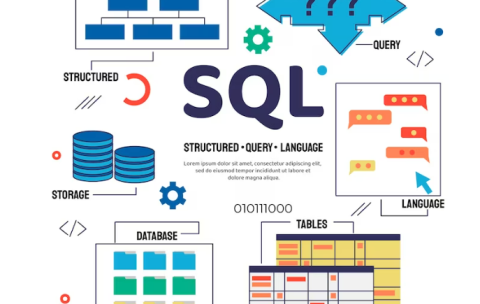
Database Management and SQL – Structured Data Mastery: SQL & Beyond
What you'll learn

QlikView/Qlik Sense Training – Interactive Data Discovery with Qlik
What you'll learn

Digital Marketing Analytics – Metrics to Strategy: Mastering Online Impact
₹1,500.00₹4,000.00
Digital Marketing Analytics – Metrics to Strategy: Mastering Online Impact
What you'll learn
R for Data Science – Data Science Proficiency with R
What you'll learn
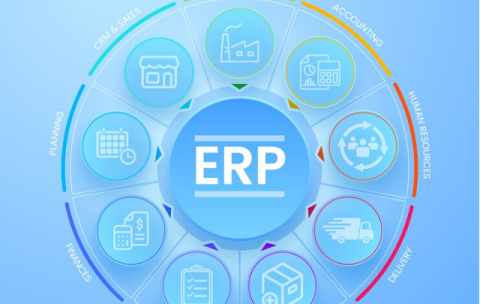
Enterprise Resource Planning (ERP) Systems – Integrating Efficiency with ERP System Expertise
₹1,499.00₹4,000.00
Enterprise Resource Planning (ERP) Systems – Integrating Efficiency with ERP System Expertise
What you'll learn

SAS Analytics Training – Mastering Analytics with SAS
What you'll learn

Excel Data Analysis and Visualization – Transforming Data into Visual Stories with Excel
₹999.00₹3,000.00
Excel Data Analysis and Visualization – Transforming Data into Visual Stories with Excel
What you'll learn

Supply Chain Analytics – Unlocking Efficiency with Supply Chain Analytics
₹1,449.00₹4,000.00
Supply Chain Analytics – Unlocking Efficiency with Supply Chain Analytics
What you'll learn

Mastering Hard Skills in the Modern Business World
What you'll learn

Financial Modeling and Valuation – Crafting Financial Blueprints and Value Assessments
₹1,299.00₹4,000.00
Financial Modeling and Valuation – Crafting Financial Blueprints and Value Assessments
What you'll learn
Database Management and SQL – Structured Data Mastery: SQL & Beyond
What you'll learn
QlikView/Qlik Sense Training – Interactive Data Discovery with Qlik
What you'll learn
Digital Marketing Analytics – Metrics to Strategy: Mastering Online Impact
₹1,500.00₹4,000.00
Digital Marketing Analytics – Metrics to Strategy: Mastering Online Impact
What you'll learn
R for Data Science – Data Science Proficiency with R
What you'll learn
Enterprise Resource Planning (ERP) Systems – Integrating Efficiency with ERP System Expertise
₹1,499.00₹4,000.00
Enterprise Resource Planning (ERP) Systems – Integrating Efficiency with ERP System Expertise
What you'll learn
SAS Analytics Training – Mastering Analytics with SAS
What you'll learn
Excel Data Analysis and Visualization – Transforming Data into Visual Stories with Excel
₹999.00₹3,000.00
Excel Data Analysis and Visualization – Transforming Data into Visual Stories with Excel
What you'll learn
Supply Chain Analytics – Unlocking Efficiency with Supply Chain Analytics
₹1,449.00₹4,000.00
Supply Chain Analytics – Unlocking Efficiency with Supply Chain Analytics
What you'll learn
Mastering Hard Skills in the Modern Business World
What you'll learn
Financial Modeling and Valuation – Crafting Financial Blueprints and Value Assessments
₹1,299.00₹4,000.00
Financial Modeling and Valuation – Crafting Financial Blueprints and Value Assessments
What you'll learn
Featured Courses

Mastery in Financial Modeling
Welcome to “Mastery in Financial Modeling,” a specialized course designed …
Mastery in Financial Modeling
What you'll learn

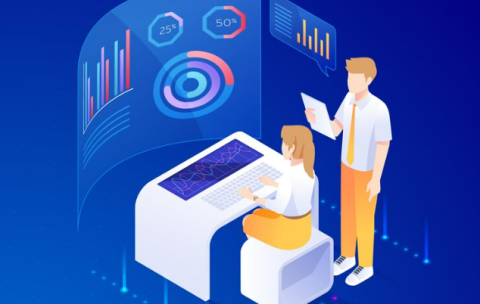
Advanced Statistical Analysis for Business Success
Welcome to “Advanced Statistical Analysis for Business Success,” a comprehensive …
Advanced Statistical Analysis for Business Success
What you'll learn
Mastering Hard Skills in the Modern Business World
Introduction: The global business environment is becoming increasingly competitive, and …
Mastering Hard Skills in the Modern Business World
What you'll learn
Popular Instructors
All Hard Skills Courses
Excel Data Analysis and Visualization – Transforming Data into Visual Stories with Excel
“Excel Data Analysis and Visualization – Transforming Data into Visual …
What you'll learn
Financial Modeling and Valuation – Crafting Financial Blueprints and Value Assessments
Financial Modeling and Valuation – Crafting Financial Blueprints and Value …
What you'll learn

Google Data Studio – Insights at a Glance with Google Data Studio
Google Data Studio – Insights at a Glance with Google …
What you'll learn

Data Analytics and Statistical Analysis for MBA – From Data to Decisions: Advanced Statistical Techniques for MBAs
“Data Analytics and Statistical Analysis for MBA – From Data …
What you'll learn
Mastery in Financial Modeling
Welcome to “Mastery in Financial Modeling,” a specialized course designed …
What you'll learn
Advanced Statistical Analysis for Business Success
Welcome to “Advanced Statistical Analysis for Business Success,” a comprehensive …
What you'll learn
Mastering Hard Skills in the Modern Business World
Introduction: The global business environment is becoming increasingly competitive, and …