Popular Instructors
All Business Strategy Courses
IBM Cognos Analytics – Empowering Decisions with IBM Cognos Analytics
IBM Cognos Analytics – Empowering Decisions with IBM Cognos Analytics …
What you'll learn
Week 1: Introduction to IBM Cognos Analytics (4 Hours)
Session 1 (2 Hours): Overview of IBM Cognos Analytics
Introduction to Business Intelligence and the Role of IBM Cognos Analytics
Navigating the IBM Cognos Analytics Interface
Overview of Key Features and Capabilities
Session 2 (2 Hours): Basic Reporting and Dashboarding
Connecting to Data Sources in Cognos
Creating Simple Reports and Dashboards
Basic Data Visualization Techniques
Week 2: Advanced Reporting and Data Exploration (6 Hours)
Session 3 (2 Hours): Advanced Reporting Techniques
Building Advanced Reports (List, Crosstab, and Chart Reports)
Applying Filters, Prompts, and Calculations
Report Formatting and Styling for Clarity and Impact
Session 4 (2 Hours): Interactive Dashboards and Visualization
Designing Interactive Dashboards
Advanced Visualization Techniques in Cognos
Using Drill-Throughs for Detailed Data Analysis
Session 5 (2 Hours): Data Exploration and Analysis
Exploratory Data Analysis in Cognos Analytics
Utilizing Cognos for Trend Analysis and Pattern Discovery
Integrating External Data and Leveraging Advanced Analytics
Week 3: Data Modeling and Framework Manager (6 Hours)
Session 6 (2 Hours): Introduction to Data Modeling
Basics of Data Modeling in Cognos
Creating and Managing Packages
Understanding the Framework Manager
Session 7 (2 Hours): Advanced Data Modeling Concepts
Building Dimensional Models
Working with Different Query Subjects
Implementing Security in Models
Session 8 (2 Hours): Practical Modeling Exercises
Hands-on Data Modeling Exercise
Best Practices in Data Modeling for Business Reporting
Reviewing and Optimizing Models
Week 4: Business Applications and Capstone Project (4 Hours)
Session 9 (2 Hours): Cognos Analytics in Business Contexts
Applying Cognos Analytics to Solve Business Problems
Case Studies: Cognos in Different Industry Settings
Discussing the Strategic Impact of Business Intelligence
Session 10 (2 Hours): Capstone Project and Course Wrap-Up
Developing a Comprehensive Business Intelligence Project Using Cognos Analytics
Presentation and Review of Capstone Projects
Course Summary and Pathways for Further Learning
This course should include a mix of lectures, hands-on practical exercises, and case studies. The capstone project in the final week would allow students to apply their learning to a comprehensive business intelligence task, ensuring they understand not only how to use IBM Cognos Analytics but also how to apply it strategically in a business context.
Power BI tailored for MBA students – Power BI for Future Business Leaders
Power BI tailored for MBA students – Power BI for …
What you'll learn
Week 1: Introduction and Basics of Power BI (4 Hours)
Session 1 (2 Hours): Introduction to Business Intelligence and Power BI
Overview of Business Intelligence (BI)
Introduction to Power BI and its position in the market
Installing Power BI Desktop
Basic Navigation and Interface Overview
Session 2 (2 Hours): Getting Started with Power BI
Connecting to Data Sources
Basic Data Import and Transformation using Power Query
Introduction to Data Modeling
Week 2: Data Analysis and Visualization (6 Hours)
Session 3 (2 Hours): Deep Dive into Data Analysis
Advanced-Data Transformation Techniques
Understanding Data Types and Categories
Introduction to DAX (Data Analysis Expressions) Basics
Session 4 (2 Hours): Creating Basic Visuals
Exploring Various Visualization Types
Creating and Customizing Charts and Graphs
Using Slicers and Filters for Interactive Reports
Session 5 (2 Hours): Advanced Visualization Techniques
Advanced DAX for Complex Calculations
Creating Interactive Dashboards
Best Practices for Data Visualization
Week 3: Reporting and Dashboarding (6 Hours)
Session 6 (2 Hours): Effective Reporting
Designing Compelling Reports
Storytelling with Data
Incorporating MBA Concepts into Reports (e.g., Financial Ratios, Market Analysis)
Session 7 (2 Hours): Advanced Dashboard Features
Drill-through and Drill-down Capabilities
Conditional Formatting and Data Alerts
Q&A and Natural Language Queries
Session 8 (2 Hours): Publishing and Sharing
Publishing Reports to Power BI Service
Sharing Dashboards and Reports
Collaboration Features in Power BI
Week 4: Integration and Real-World Application (4 Hours)
Session 9 (2 Hours): Integrating Power BI with Other Tools
Integration with Excel and Other Microsoft Services
Connecting Power BI to External Databases
Overview of APIs and Embedded Analytics
Session 10 (2 Hours): Capstone Project and Course Wrap-up
Applying Skills to a Real-World Business Case
Creating a Full Report and Dashboard from Scratch
Course Recap and Further Learning Resources
Each session can include a mix of lectures, hands-on exercises, and real-world case studies to ensure that students not only learn the technical aspects of Power BI but also understand how to apply these skills in a business context. The capstone project in the final session should ideally be a comprehensive task that requires students to apply all the skills they've learned throughout the course.
QlikView/Qlik Sense Training – Interactive Data Discovery with Qlik
QlikView/Qlik Sense Training – Interactive Data Discovery with Qlik is …
What you'll learn
Week 1: Introduction to QlikView and Qlik Sense (4 Hours)
Session 1 (2 Hours): Fundamentals of QlikView and Qlik Sense
Overview of QlikView and Qlik Sense: Features and Differences
The Role of Qlik in Business Intelligence and Data Visualization
Installing and Setting Up QlikView and Qlik Sense
Session 2 (2 Hours): Basics of Data Loading and Modeling
Connecting to Data Sources
Basic Data Modeling Techniques in Qlik
Understanding Qlik’s Associative Model
Week 2: Data Visualization and Dashboard Creation (6 Hours)
Session 3 (2 Hours): Creating Basic Visualizations
Exploring Chart Types and Visualization Options
Designing Interactive Dashboards in Qlik Sense
Best Practices for Effective Data Presentation
Session 4 (2 Hours): Advanced Visualization Techniques
Utilizing Advanced Chart Types and Custom Visualizations
Implementing Set Analysis for Comparative Analysis
Hands-on Practice with Complex Dashboard Creation
Session 5 (2 Hours): Storytelling and Reporting in Qlik
Using Qlik Sense for Storytelling and Report Generation
Integrating Narrative into Dashboards
Exporting Reports and Visualizations
Week 3: Advanced Topics in QlikView and Qlik Sense (6 Hours)
Session 6 (2 Hours): Advanced Data Modeling
Advanced Data Transformation Techniques
Scripting in QlikView for Custom Data Models
Complex Data Structures and Optimization Techniques
Session 7 (2 Hours): Set Analysis and Data Exploration
Deep Dive into Set Analysis for Complex Data Queries
Dynamic Data Exploration Techniques
Hands-on Exercises on Data Exploration
Session 8 (2 Hours): Integrating Qlik with External Data Sources
Connecting to Various Data Sources (SQL, Web, APIs)
Implementing Data Security and Governance
Best Practices for Data Integration
Week 4: Practical Applications and Capstone Project (4 Hours)
Session 9 (2 Hours): Applying Qlik in Business Scenarios
Case Studies: How Businesses Leverage Qlik for Analytics
Discussing Real-World Business Problems and Solutions
Ethical Considerations in Data Visualization
Session 10 (2 Hours): Capstone Project and Course Wrap-Up
Developing a Comprehensive Qlik Project based on Real Business Data
Presentation and Review of Capstone Projects
Course Summary and Future Learning Opportunities
The course should be a mix of lectures, demonstrations, and practical exercises, with a focus on applying QlikView/Qlik Sense skills to business analytics scenarios. The capstone project in the final week would allow students to apply their learning to develop a full-scale business intelligence solution, ensuring they not only know how to use Qlik tools but also understand their strategic application in business.
Tableau for Business Intelligence – Business Intelligence with Tableau
Tableau for Business Intelligence – Business Intelligence with Tableau is an …
What you'll learn
Week 1: Introduction to Tableau and Data Visualization (4 Hours)
Session 1 (2 Hours): Fundamentals of Tableau
Introduction to Business Intelligence and Data Visualization
Overview of Tableau: Features and Capabilities
Installing Tableau and Navigating the Interface
Session 2 (2 Hours): Basic Data Visualization Concepts
Principles of Effective Data Visualization
Connecting to Data Sources in Tableau
Creating Basic Charts and Graphs
Week 2: Intermediate Tableau Skills and Visualization Techniques (6 Hours)
Session 3 (2 Hours): Exploring Data with Tableau
Deep Dive into Tableau Data Handling
Data Preparation and Cleaning in Tableau
Advanced Chart Types and Visualization Techniques
Session 4 (2 Hours): Building Interactive Dashboards
Designing Dashboards for Business Intelligence
Adding Filters, Actions, and Tooltips for Interactivity
Best Practices for Dashboard Layout and Design
Session 5 (2 Hours): Data Storytelling with Tableau
Crafting a Narrative with Data
Techniques for Effective Data Presentation and Storytelling
Utilizing Tableau’s Story Points Feature
Week 3: Advanced Tableau Features and Analytics (6 Hours)
Session 6 (2 Hours): Advanced Data Analysis in Tableau
Advanced Calculations with Tableau (Calculated Fields, Table Calculations)
Using Parameters for Dynamic Visualizations
Introduction to Geographic Mapping in Tableau
Session 7 (2 Hours): Tableau for Business Analytics
Analyzing Business Data in Tableau (Sales, Finance, Marketing)
Time-Series Analysis and Forecasting
Exploring Tableau Statistical Functions
Session 8 (2 Hours): Integrating Tableau with Other Tools
Integrating Tableau with SQL and Other Databases
Utilizing Tableau with Big Data
Exporting and Sharing Tableau Insights
Week 4: Practical Application and Capstone Project (4 Hours)
Session 9 (2 Hours): Implementing Tableau in Business Strategy
Case Studies of Tableau in Business Decision-Making
Ethical Considerations in Data Visualization
Strategies for Effective Use of BI Tools in Organizations
Session 10 (2 Hours): Capstone Project and Course Wrap-Up
Developing a Comprehensive Tableau Project on a Business Case
Presentation of Capstone Projects
Course Summary and Pathways for Further Learning
The course should include a mix of lectures, demonstrations, and practical exercises, with a focus on applying Tableau skills to real-world business scenarios. The capstone project in the final week would allow students to apply their learning to develop a full-fledged Tableau dashboard based on a realistic business dataset, ensuring they understand not only how to use Tableau but also how to apply it strategically in a business context.
Advanced Excel for Business -Excel Mastery: Business Insights & Efficiency
Advanced Excel for Business – Excel Mastery: Business Insights & …
What you'll learn
Week 1: Excel Fundamentals and Data Management (4 Hours)
Session 1 (2 Hours): Review of Excel Basics and Introduction to Advanced Features
Quick Refresher on Basic Excel Functions and Formulas
Introduction to Advanced Excel Features (e.g., PivotTables, Advanced Charting)
Session 2 (2 Hours): Data Management and Analysis in Excel
Data Import and Cleaning Techniques
Data Sorting, Filtering, and Conditional Formatting
Introduction to Data Validation and Data Protection Methods
Week 2: Advanced Formulas and Functions (6 Hours)
Session 3 (2 Hours): Mastering Complex Formulas
Advanced Use of Logical Functions (IF, AND, OR)
Lookup Functions (VLOOKUP, HLOOKUP, INDEX, MATCH)
Date and Time Functions
Session 4 (2 Hours): Dynamic Formulas and Array Functions
Understanding and Implementing Array Formulas
Introduction to Dynamic Named Ranges
Using TEXT and Other String Functions
Session 5 (2 Hours): Practical Exercise on Business Data Analysis
Hands-on Case Study using Complex Formulas
Analyzing Business Data with Advanced Excel Functions
Week 3: PivotTables, Data Visualization, and Introduction to Dashboards (6 Hours)
Session 6 (2 Hours): Mastering PivotTables and PivotCharts
In-depth Exploration of PivotTables
Advanced PivotTable Techniques (Grouping, Slicers, Calculated Fields)
Creating and Customizing PivotCharts
Session 7 (2 Hours): Advanced Data Visualization Techniques
Advanced Charting and Graphing Techniques
Creating Interactive Excel Dashboards
Visualization Best Practices
Session 8 (2 Hours): Real-world Business Analysis
Applying PivotTables and Visualization Techniques to Business Case Studies
Interactive Dashboard Creation Based on Real Data
Week 4: Financial Modeling and Advanced Applications (4 Hours)
Session 9 (2 Hours): Introduction to Financial Modeling in Excel
Basic Principles of Financial Modeling
Building Financial Models (Cash Flow, Budgeting, Forecasting)
Sensitivity Analysis using Data Tables and Scenario Manager
Session 10 (2 Hours): Capstone Project and Course Wrap-up
Applying Advanced Excel Skills to a Comprehensive Business Case
Group Project Presentations and Feedback
Course Review and Discussion on Further Learning Paths
Each session should include a mix of lectures, demonstrations, and hands-on exercises. The emphasis should be on practical application, using real-world business scenarios and case studies to ensure students understand how to apply their Excel skills in a business context. The final capstone project should encourage students to use all the skills they've learned to solve a complex business problem. This structure will ensure that MBA students gain not only technical proficiency in advanced Excel features but also the ability to apply these skills strategically in their professional roles.
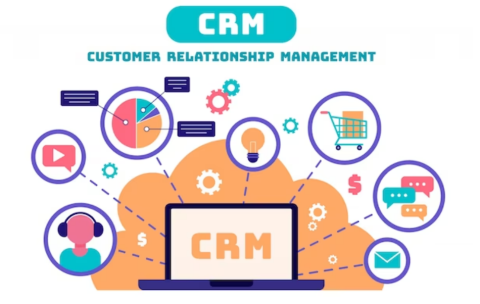
Customer Relationship Management (CRM) Systems – Optimizing Engagement: Mastering CRM Dynamics
“Customer Relationship Management (CRM) Systems – Optimizing Engagement: Mastering CRM …
What you'll learn
Week 1: Introduction to CRM and Its Strategic Importance (4 Hours)
Session 1 (2 Hours): Fundamentals of CRM
Introduction to Customer Relationship Management
Evolution of CRM and Its Role in Modern Businesses
Overview of CRM Systems and Technologies
Session 2 (2 Hours): Strategic Importance of CRM
Aligning CRM with Business Strategy
Understanding the Customer Journey
Role of CRM in Customer Retention and Acquisition
Week 2: CRM Systems and Their Functionalities (6 Hours)
Session 3 (2 Hours): Overview of Popular CRM Systems
Comparison of Different CRM Systems (e.g., Salesforce, Microsoft Dynamics, Zoho)
Cloud-based CRM vs. On-premise Solutions
Integration with Other Business Systems
Session 4 (2 Hours): Key Functionalities of CRM Systems
Sales Force Automation
Customer Service and Support
Marketing Automation within CRM
Session 5 (2 Hours): Data Management in CRM
Managing and Segmenting Customer Data
Data Analytics and Reporting Features
Ensuring Data Privacy and Compliance
Week 3: Implementing and Optimizing CRM Systems (6 Hours)
Session 6 (2 Hours): CRM Implementation Strategies
Best Practices for CRM Implementation
Overcoming Common Implementation Challenges
Case Studies of Successful CRM Implementations
Session 7 (2 Hours): User Adoption and Training
Strategies for Ensuring User Adoption and Engagement
Training Employees on CRM Usage
Measuring CRM Adoption Success
Session 8 (2 Hours): CRM System Optimization and Advanced Features
Ongoing Management and Maintenance of CRM Systems
Exploring Advanced Features (AI, IoT Integration, etc.)
Future Trends in CRM Technology
Week 4: Practical Applications and Capstone Project (4 Hours)
Session 9 (2 Hours): Integrating CRM into Business Processes
Developing Customer-Centric Strategies Using CRM
CRM in Customer Analytics and Insight Generation
Ethical Considerations in Customer Data Handling
Session 10 (2 Hours): Capstone Project and Course Wrap-Up
Group Project: Developing a CRM Strategy for a Real or Simulated Business Scenario
Presentation of Projects and Feedback
Course Summary and Pathways for Further Learning
The course should include a mix of lectures, case studies, and practical exercises, possibly using a CRM software simulation or sandbox environment. The capstone project in the final week would allow students to apply the concepts and techniques learned to a realistic business scenario, reinforcing their understanding and practical skills in CRM systems. This structure ensures that MBA students gain not only a technical understanding of CRM systems but also learn how to strategically apply these tools to enhance customer relationships and drive business success.


